We put the Samsung Galaxy A55 5G through our rigorous SBMARK Display test suite to measure its performance across six criteria. In the results of this test, we will analyze how it performed in a series of tests and in several common use cases.
Overview
Key Display Specifications:
- 6.6-inch AMOLED (screen-to-body ratio ~86.9%)
- Dimensions: 161.1 x 77.4 x 8.2 mm (6.23 x 3.02 x 0.32 inches)
- Resolution: 1080 x 2340 pixels, (density ~396 ppi)
- Aspect ratio: 19.5:9
- Refresh rate: 120Hz
Pros
- Natural rendering and good readability in sunlight
- Good color rendering in most lighting environments
- Pleasant video experience, with a brightness suitable for HDR10 videos
Against
- Poor handling of unwanted touches on the screen
- Excessive automatic brightness in dark environments, even with the blue light filter turned on
- Occasional pink to green fringing on screen when viewing from an angle
The display of the Samsung Galaxy A55 5G delivered impressive performance for its high-end segment.
The device’s screen measured a peak brightness in sunlight conditions of 1638 nits, significantly higher than advertised and well above the 1344 nits of its A54 5G predecessor. Peak brightness came close to the peak level of the premium Samsung Galaxy S23 model, which was measured at 1600 nits.
Our testers noticed improvements in how the A55 5G’s display handles sunlight conditions, particularly in gamut and color. Faces were better rendered and colors appeared more natural.
The A55 5G, like its predecessor and other mid-range devices, tended to show pink and green fringing on the display when viewed from an angle.
When watching videos, the A55 5G’s screen brightness offers good rendering and a good level of detail in dark areas. However, there was an occasional slight orange cast when viewing videos.
The management of artefacts, in terms of reflectance and flicker, has been slightly improved compared to the already weak performance of the predecessor.
Test summary
About SBMARK display tests: For scoring and analysis in our smartphones and other display reviews, SBMARK engineers perform a series of objective and perceptual tests under controlled laboratory and real-life conditions. Please note that we evaluate display attributes using only the device’s built-in display hardware and its still image (gallery) and video apps with default settings. (For in-depth information on how we evaluate smartphones and other displays, see our articles “How SBMARK Tests Display Quality” and “A Closer Look at SBMARK Display Tests.”
The following section brings together key elements of our comprehensive testing and analysis performed in SBMARK laboratories. Detailed performance evaluations in the form of reports are available upon request. Do not hesitate to contact us.
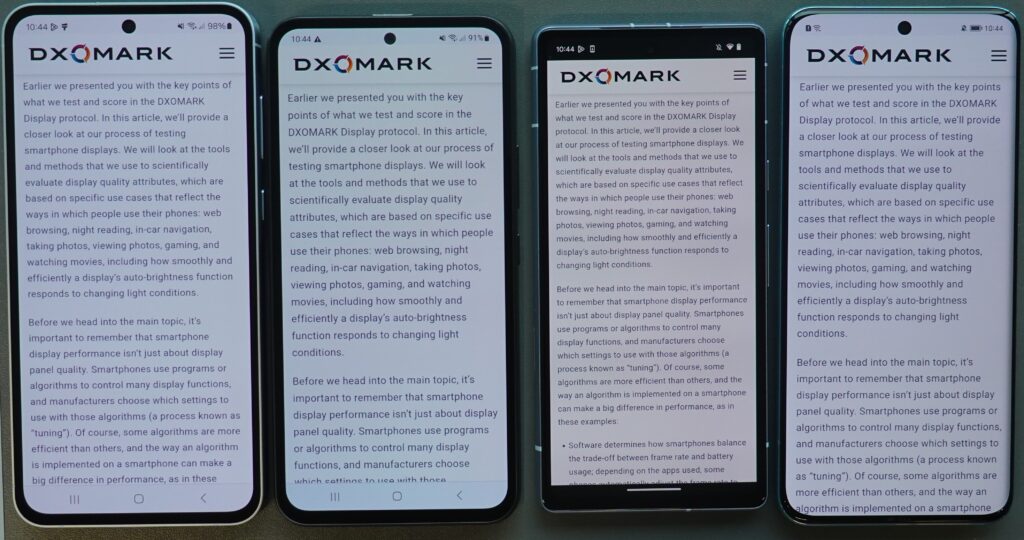
How the display readability score is composed
Readability evaluates the ease and comfort with which users can read fixed content (photos and web) on the display in various real-life conditions. SBMARK uses its display stand to recreate ambient light conditions ranging from total darkness to bright sunlight. In addition to laboratory tests, perceptual analysis is also carried out in real-life environments.
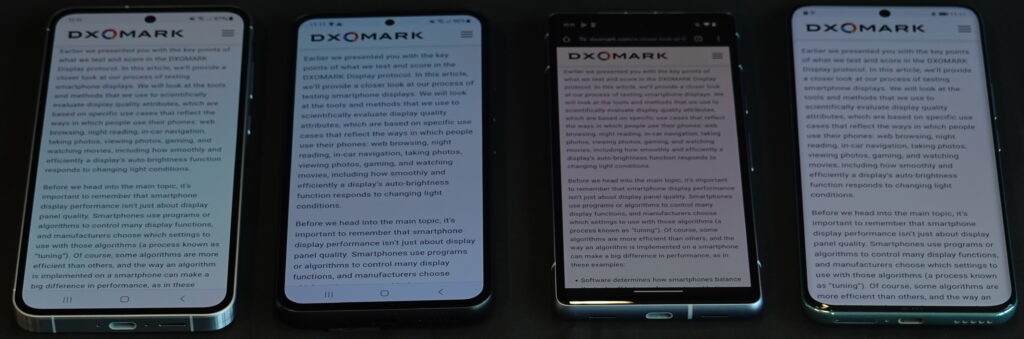
Readability in an indoor environment (1000 lux).

From left to right: Samsung Galaxy A55 5G, Samsung Galaxy A54 5G, Google Pixel 7a, Honor 90
(Photo for illustrative purposes only)
Readability in an outdoor environment (20,000 lux).

From left to right: Samsung Galaxy A55 5G, Samsung Galaxy A54 5G, Google Pixel 7a, Honor 90
(Photo for illustrative purposes only)
Readability in a sunny environment (>90,000 lux).

From left to right: Samsung Galaxy A55 5G, Samsung Galaxy A54 5G, Google Pixel 7a, Honor 90
(Photo for illustrative purposes only)
Readability at a 45° angle


From left to right: Samsung Galaxy A55 5G, Samsung Galaxy A54 5G, Google Pixel 7a, Honor 90
(Photo for illustrative purposes only)
Measurement of luminance uniformity
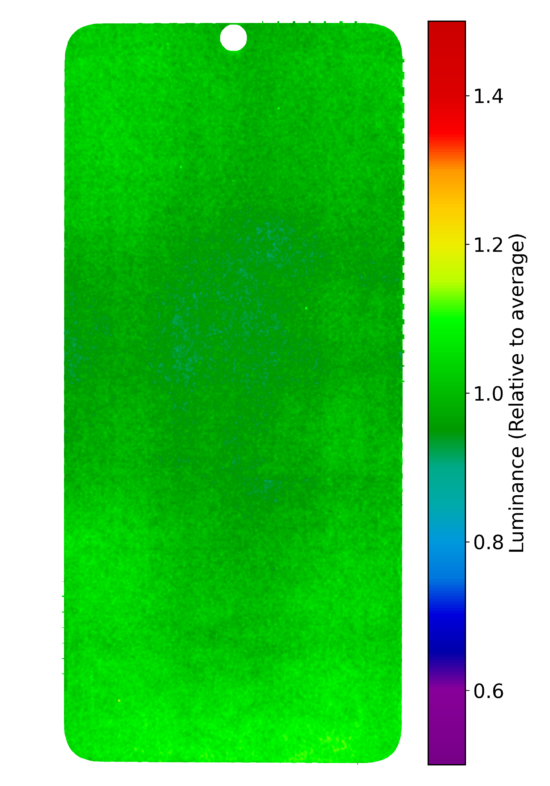
This graph shows display uniformity with a gray pattern at 20%. The more visible the green color, the more uniform the display will be.
How the display color score is composed
The color attribute evaluates the device’s ability to accurately reproduce colors. The measurements taken concern fidelity, white point color and gamut coverage. We perform color evaluations for different lighting conditions to see how well the device can handle color in its surroundings. Colors are measured using a spectrophotometer in a controlled lighting environment. The perceptual analysis of the color rendering takes place compared to the reference model displayed on a calibrated professional monitor.
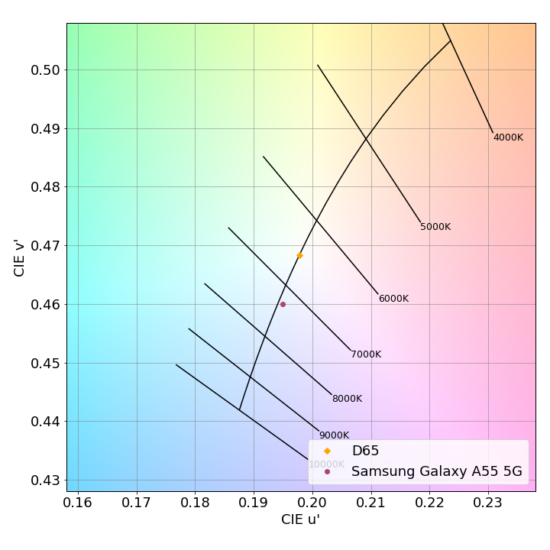
White point under D65 illuminant at 1000 lux
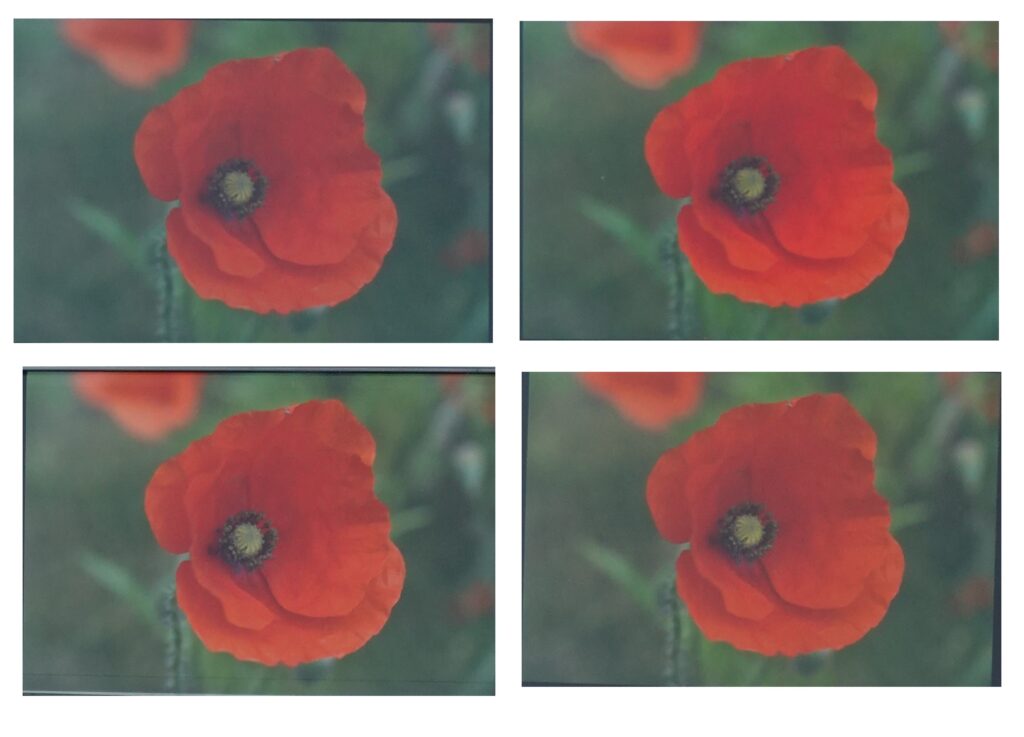
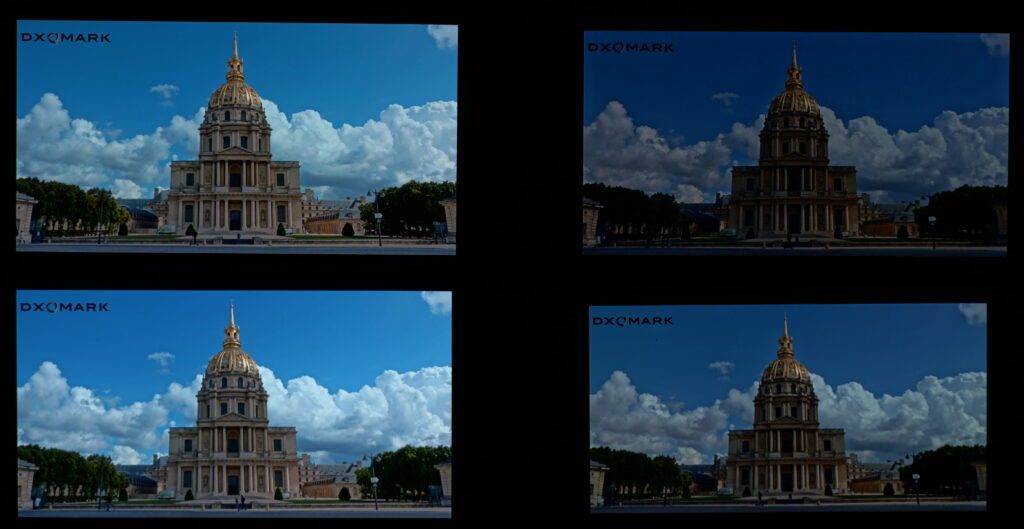
Indoor color rendering (1000 lux)

Clockwise from top left: Samsung Galaxy A55 5G, Samsung Galaxy A54 5G, Google Pixel 7a, Honor 90
(Photo for illustrative purposes only)
Outdoor color rendering (20,000 lux)
Clockwise from top left: Samsung Galaxy A55 5G, Samsung Galaxy A54 5G, Google Pixel 7a, Honor 90
(Photo for illustrative purposes only)
Color rendering in sunlight (>90,000 lux)
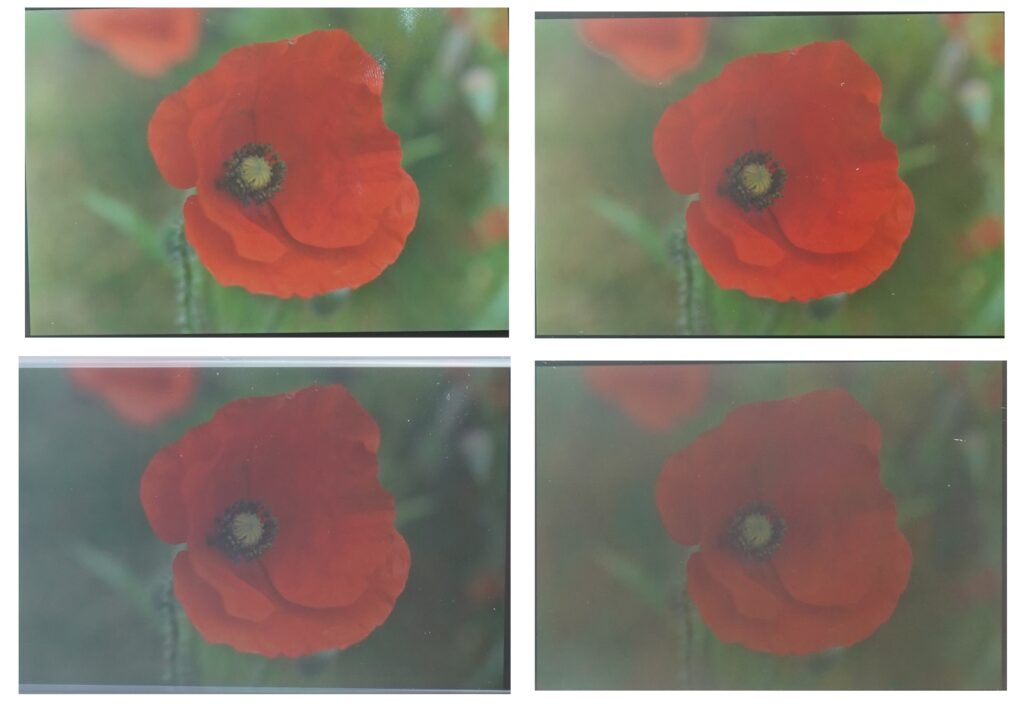
Clockwise from top left: Samsung Galaxy A55 5G, Samsung Galaxy A54 5G, Google Pixel 7a, Honor 90
(Photo for illustrative purposes only)
Color fidelity measurements
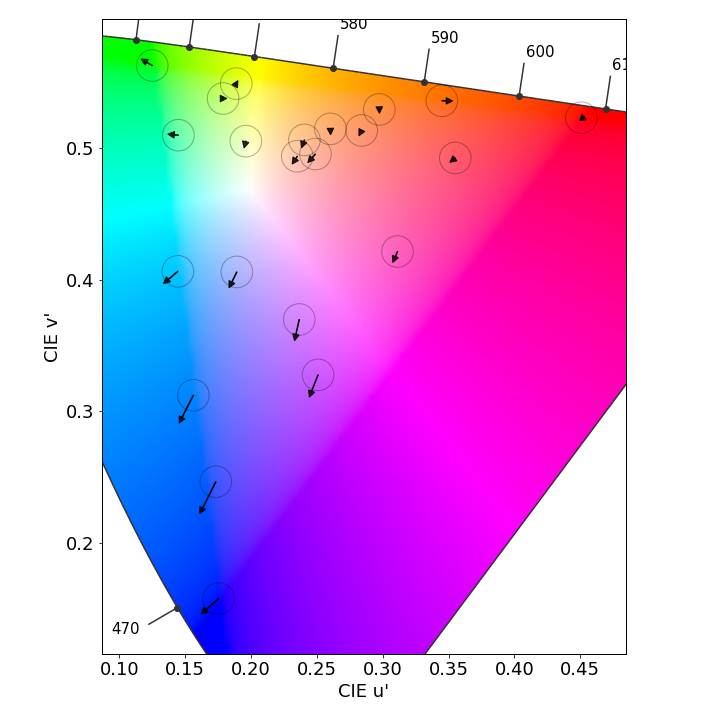
Samsung Galaxy A55 5G, color fidelity at 1000 lux in the sRGB color space
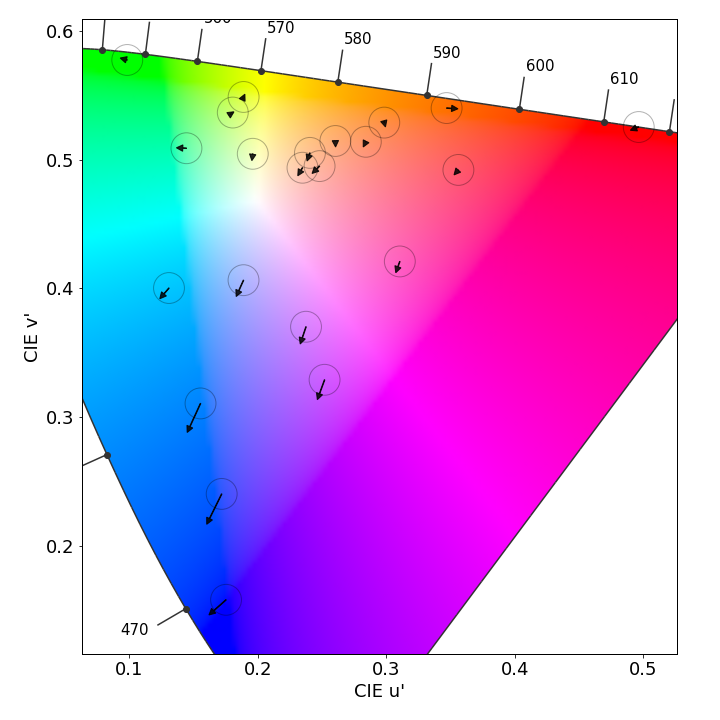
Samsung Galaxy A55 5G, color fidelity at 1000 lux in the Display-P3 color space
Each arrow represents the color difference between a target color model (arrow base) and its actual measurement (arrow tip). The longer the arrow, the more visible the color difference. If the arrow remains inside the circle the color difference will only be visible to expert eyes.
Color behavior on the corner
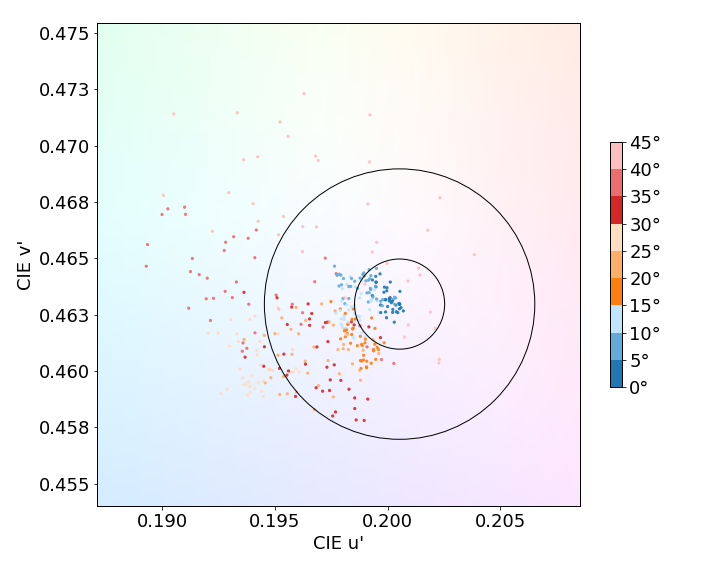
This graph shows the color shift when the screen is tilted. Each point represents a measurement at a particular angle. The dots inside the inner circle show no color change in the corner; those between the inner and outer circles have changes that only trained experts will see; but those that fall outside the outer circle are noted.
Color shift on the corner
From left to right: Samsung Galaxy A55 5G, Samsung Galaxy A54 5G, Google Pixel 7a, Honor 90
(Photos are illustrative only)
How the Display Video score is composed
Our video attribute evaluates each device’s Standard Dynamic Range (SDR) and High Dynamic Range (HDR10) video handling in indoor and low-light conditions. We measure the tone mapping, color gamut, brightness and contrast of the display. We perform perceptual analysis Cons our professional reference monitor (Sony BVM-HX310) to ensure rendering meets artistic intent.
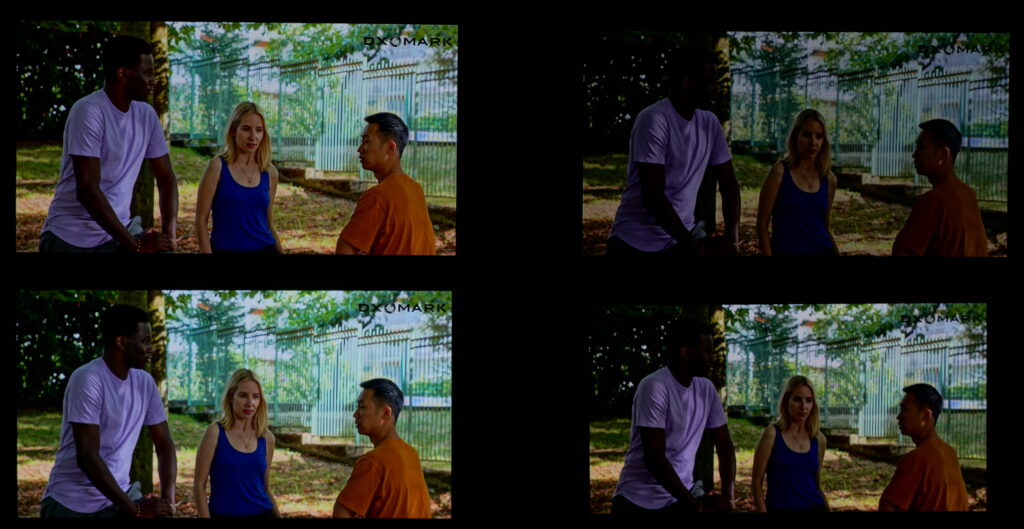
Video rendering in a low light environment (0 lux).
Clockwise from top left: Samsung Galaxy A55 5G, Samsung Galaxy A54 5G, Google Pixel 7a, Honor 90
(Photo for illustrative purposes only)
Clockwise from top left: Samsung Galaxy A55 5G, Samsung Galaxy A54 5G, Google Pixel 7a, Honor 90
(Photo for illustrative purposes only)
Gamut coverage for video content
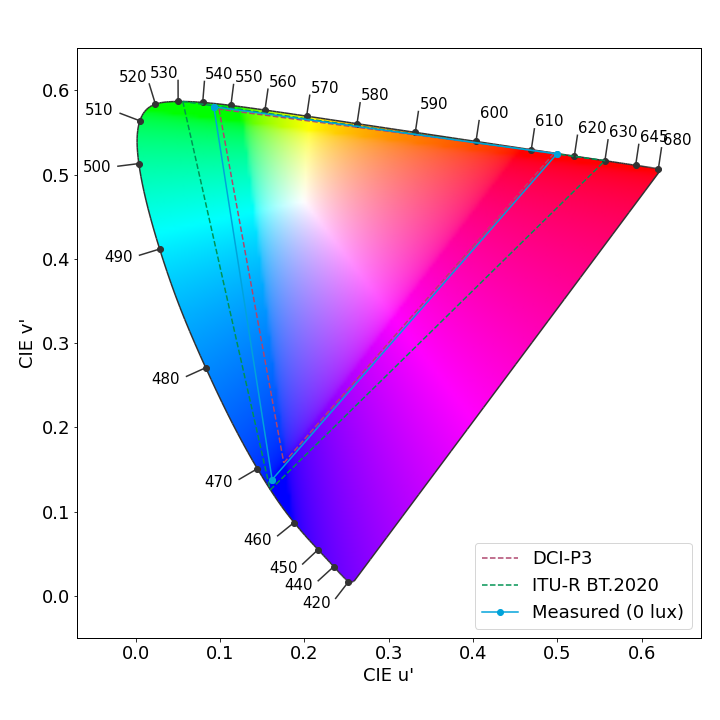

Primary colors are measured in both HDR10 and SDR. The extracted color gamut shows the extent of the color area that the device can reproduce. To meet artistic intent, the measured gamma must match the primary color space of each video.
How the Display Motion Score is composed
The motion attribute evaluates dynamic content handling. Dropped frames, motion blur, and playback artifacts are examined using games and videos.
Dropped video frames


These long exposure photos have the number of frame irregularities in a 30 second video. Good performance shows a regular pattern (a flat gray image or a drop-down pattern).
How the Display Touch score is composed
To evaluate touch, SBMARK uses a touch robot and a high-speed camera to play and record a series of scenarios for evaluating smoothness, accuracy and response time.
This response time test accurately evaluates the time that elapses between a single touch of the robot on the screen and the displayed action. This test is applied to activities that require high responsiveness, such as gaming.
How the display artifact score is composed
Evaluating artifacts means checking for performance, image rendering, and motion defects that can impact the end-user experience. SBMARK precisely measures device reflectance and the presence of flicker, and evaluates the impact of residual aliasing when playing video games, among other features.
Aliasing (foreground)

Samsung Galaxy A55 5G
(Photo for illustrative purposes only)

Samsung Galaxy A55 5G – Crop 1

Samsung Galaxy A55 5G – Crop 2

Samsung Galaxy A55 5G – Crop 3

Start a new Thread